Description
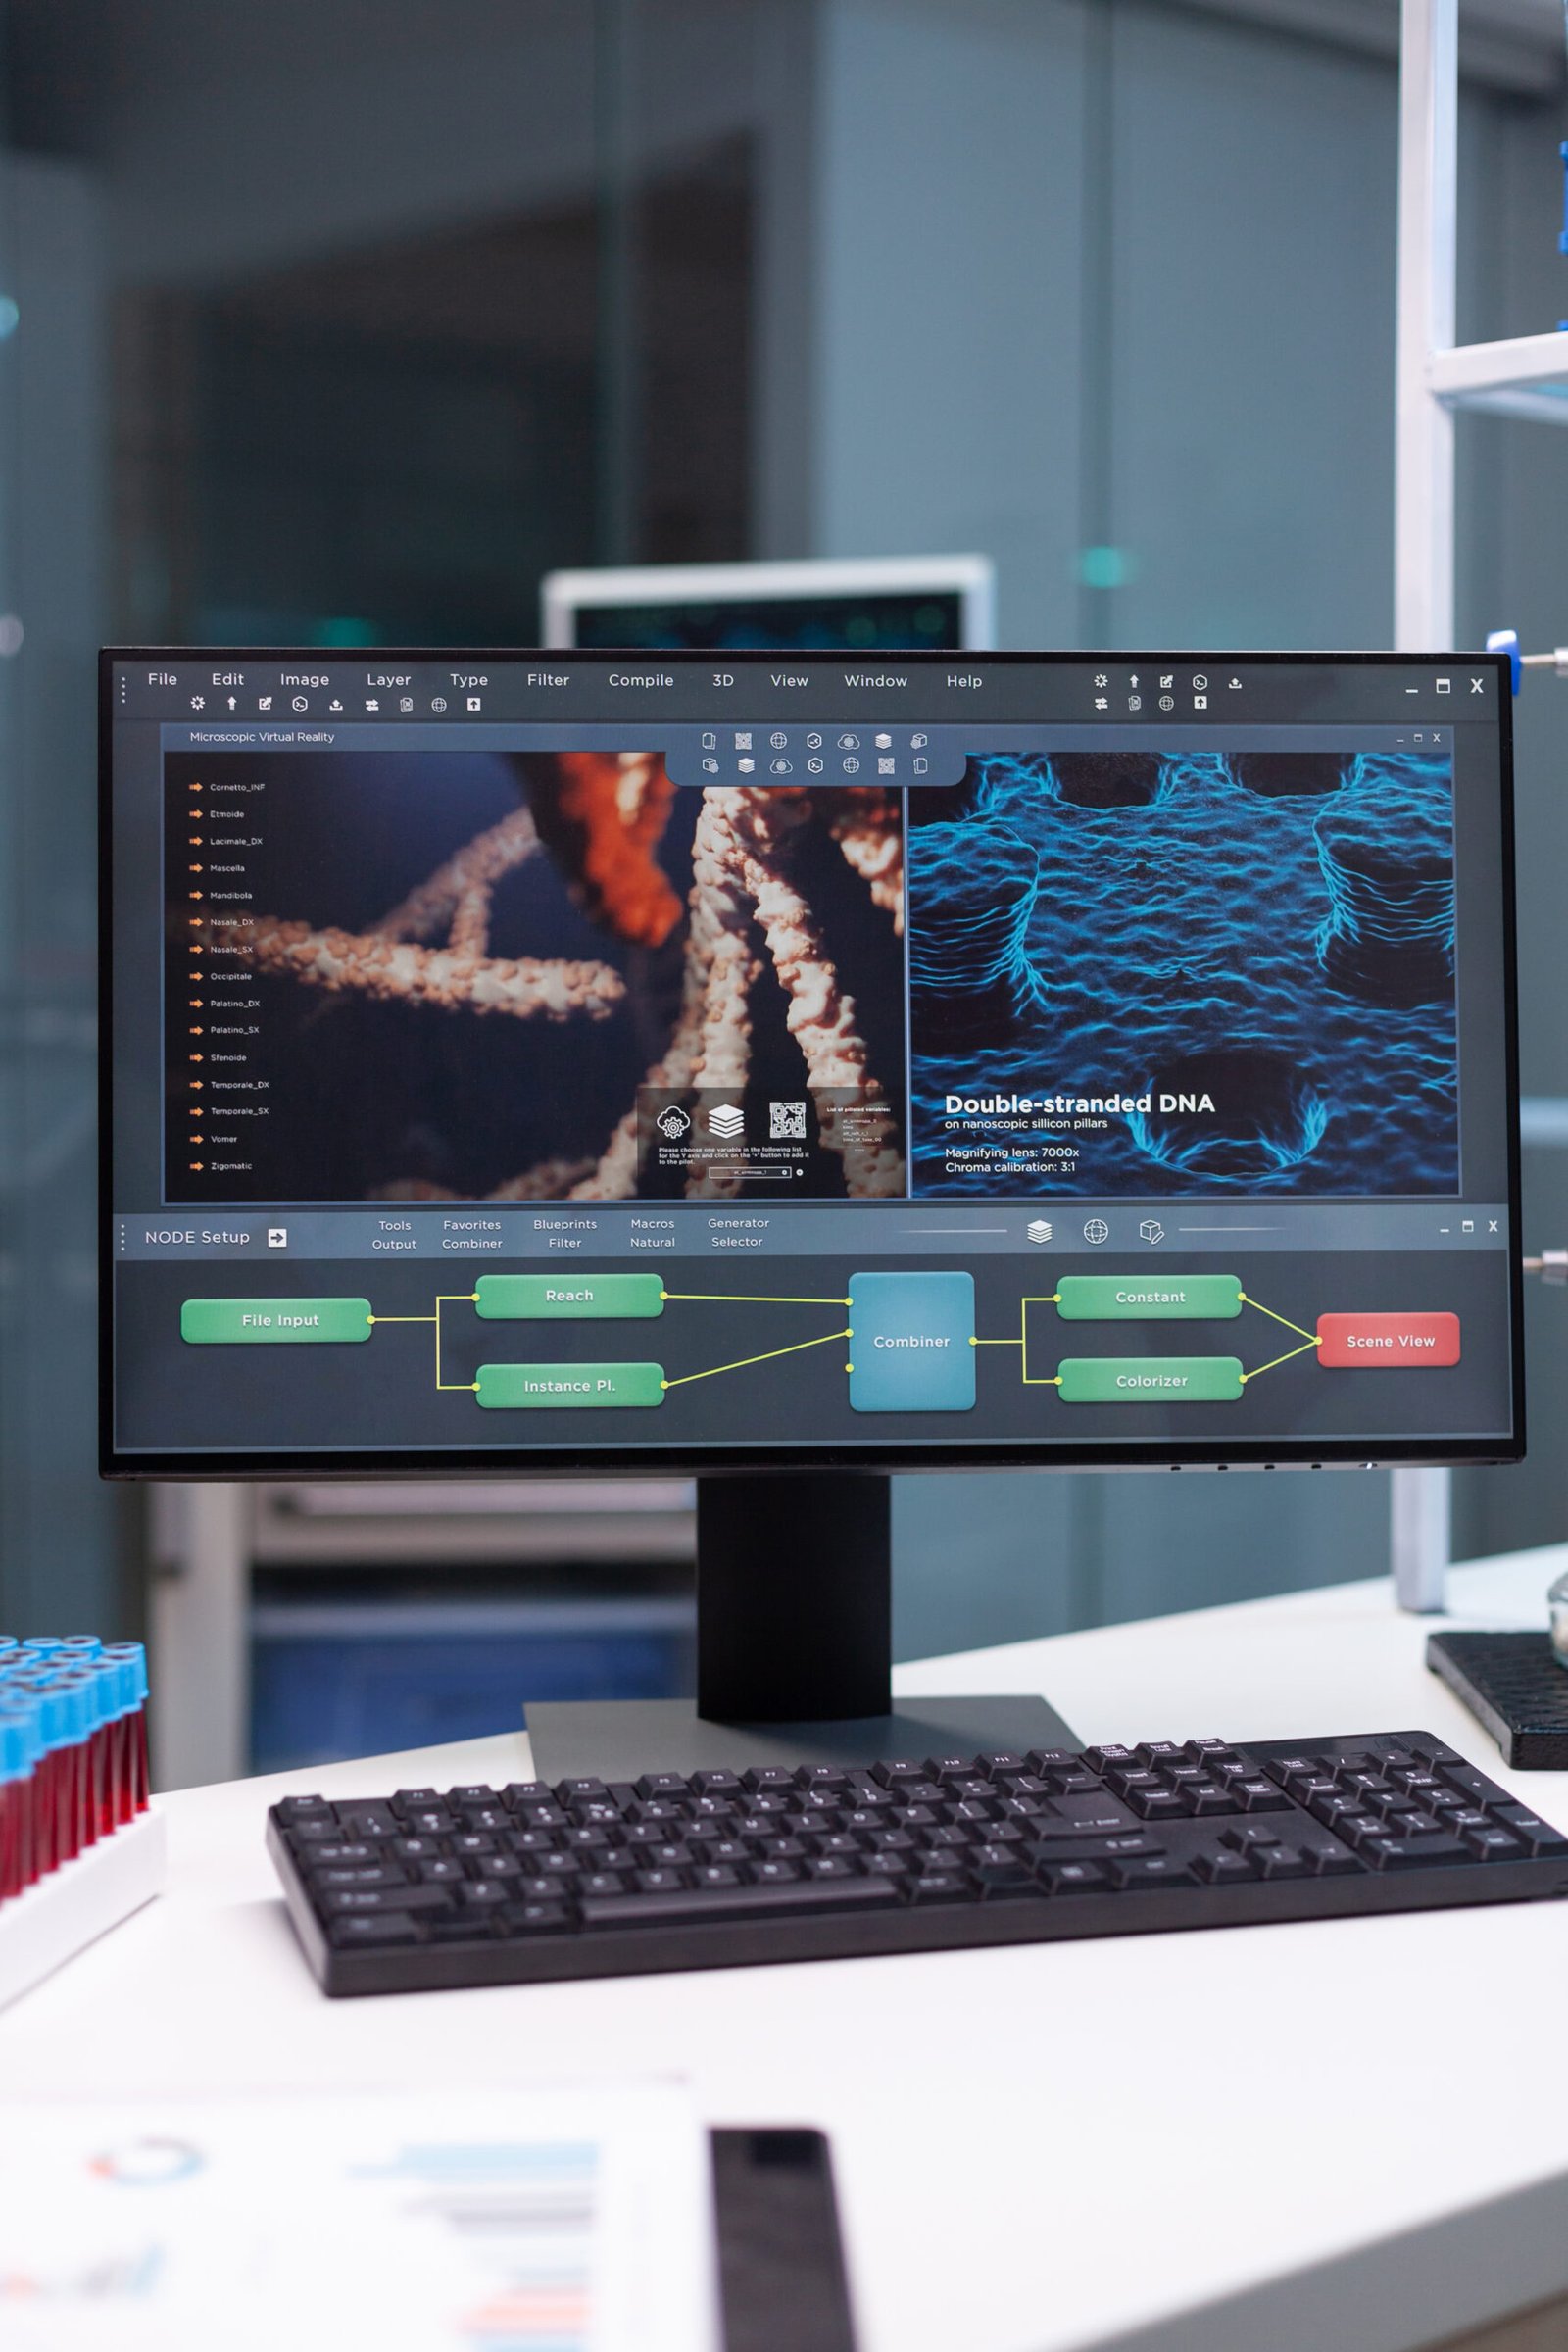
Flownizer 2D/3D PIV software stands out with its sophisticated direct cross-correlation method, which enables highly accurate measurements that are crucial for effective fluid dynamics analysis. This methodology ensures smooth flow visualization, allowing researchers and engineers to derive actionable insights from complex data sets. The efficacy of Flownizer is reinforced by its versatile applications across diverse domains, including airflow studies, water flow assessments, and intricate microscope applications, making it suitable for both laboratory environments and field studies.
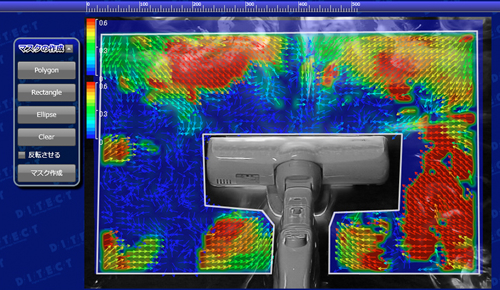
One of the most prominent benefits of Flownizer is its advanced preprocessing tools, which significantly enhance image quality prior to analysis. These tools contribute to the reduction of error vectors, thereby increasing the reliability of the measurements obtained. This capability is particularly important in ensuring that the data reflects true flow behavior without interferences from suboptimal imaging conditions. Consequently, users can trust that their results will be consistent and represent the fluid dynamics they are investigating accurately.
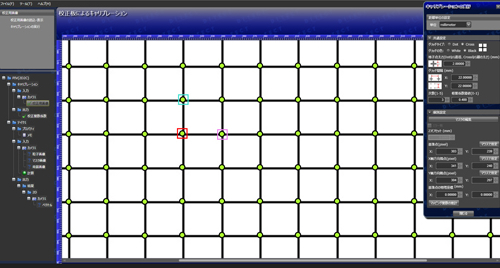
Moreover, Flownizer is equipped with sophisticated calibration methods that address lens distortion—a common challenge in particle image velocimetry. By correcting these distortions in both the 2D and 3D domains, Flownizer improves the precision of measurements, which is vital for research applications that demand high fidelity data. Consequently, users can expect a higher level of detail in their flow investigations, fostering improved understanding and interpretation of the phenomena under study. The integration of these features positions Flownizer as a comprehensive solution for researchers who require an advanced yet user-friendly dataset analysis platform.
Data Analysis and Visualization with Flownizer
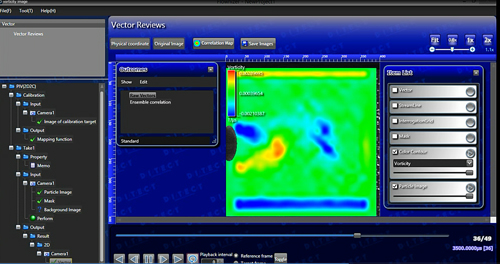
Flownizer stands as a premier software solution for particle image velocimetry (PIV), offering advanced data analysis and visualization capabilities that are integral to the study and understanding of fluid dynamics. One of the core strengths of Flownizer is its ability to generate a variety of essential result items, including velocity vectors, Reynolds stress, turbulent kinetic energy, and vortex structures. These outputs provide deep insights into the flow characteristics of a given fluid system, enabling researchers and engineers to analyze complex fluid behavior effectively.
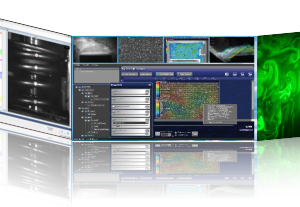
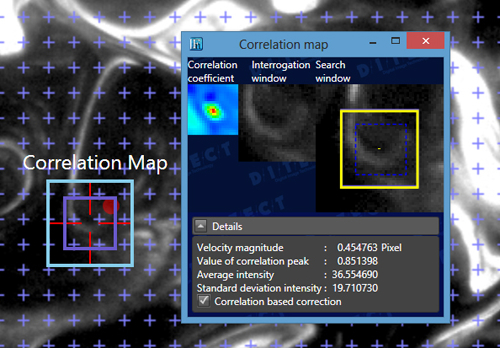
The visualization tools embedded within Flownizer are equally impressive, allowing users to translate raw data into accessible and informative graphical outputs. Among the visualizations produced are raw vectors that illustrate instantaneous velocity changes, mean vectors that capture average flow patterns over a specified duration, and animated correlation coefficient maps that depict the degree of correlation between velocity fields. These visual outputs extend beyond merely presenting data; they offer intuitive insights that can enhance decision-making processes in fluid dynamics research and application.
Understanding complex fluid dynamics can be challenging, particularly when working with large datasets. Flownizer simplifies this process by presenting intricate results through user-friendly interfaces. The software’s visualization capabilities play a crucial role in making the analysis of fluid behavior more approachable. For instance, animated maps can help in illustrating transient phenomena, such as turbulence, while vector plots enable a clear understanding of flow direction and intensity. By transforming complex data into digestible formats, Flownizer empowers users to visualize and interpret fluid dynamics like never before.
As such, it is evident that Flownizer not only excels in data analysis but also enhances the overall comprehension of fluid dynamics through its sophisticated visualization functionalities.